
How is Mapletree Industrial Trust doing? Let’s check it out!
Mapletree Industrial Trust (“MIT”) is a real estate investment trust listed on SGX. The principal investment strategy for MIT is to invest in a diversified portfolio with state-of-the-art data centers.
As at 31 December 2021, MIT’s total assets under management was S$8.6 billion, which comprised 86 properties in Singapore and 57 properties in North America (including 13 data centers held through the joint venture with Mapletree Investments Pte Ltd). MIT’s property portfolio includes Data Centers, Hi-Tech Buildings, Business Park Buildings, Flatted Factories, Stack-up/Ramp-up Buildings and Light Industrial Buildings.
Let’s take a look at what Mapletree Industrial Trust got to offer.
Overview of Mapletree Industrial Trust
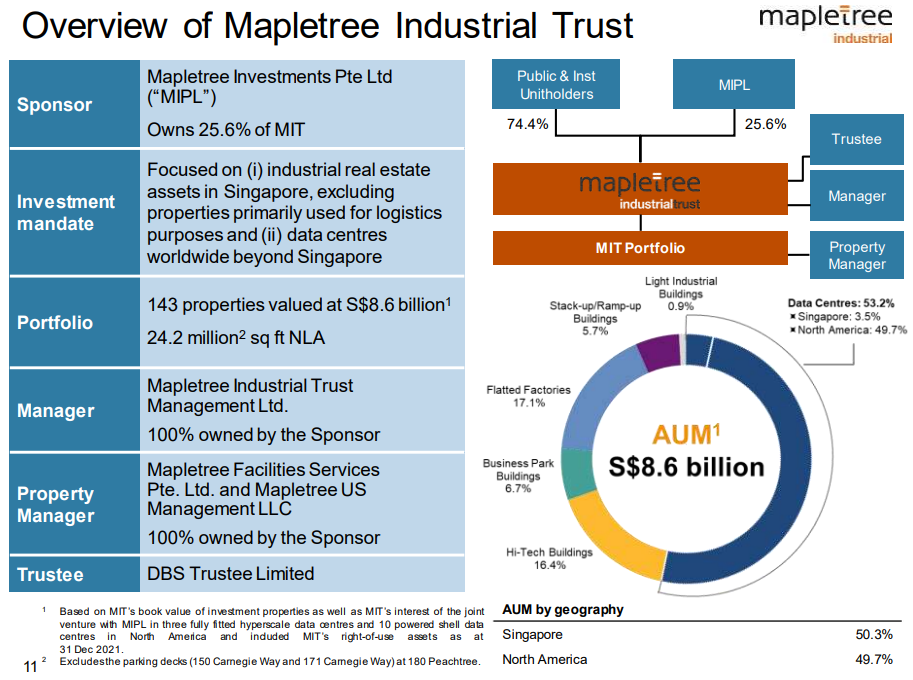
Key Highlights to Note about MapleTree Industrial Trust:
- Sponsor: Mapletree Investments Pte Ltd (MIPL) owns 25.6% of MIT.
- Portfolio: 143 properties valued at S$8.6 billion
- AUM by Geography: Singapore (50.3%) and North America (49.7%)
- Diversified Portfolio of Properties: Data Centres, Flatted Factories, Hi-Tech Buildings, Stack-Up Buildings, Business Park Buildings, Light Industrial Buildings
- One of the best performing REITs since IPO: Over 311.9% Total Return since IPO (Capital Appreciation and Sum of Dividends)
Gross Revenue & Net Property Income
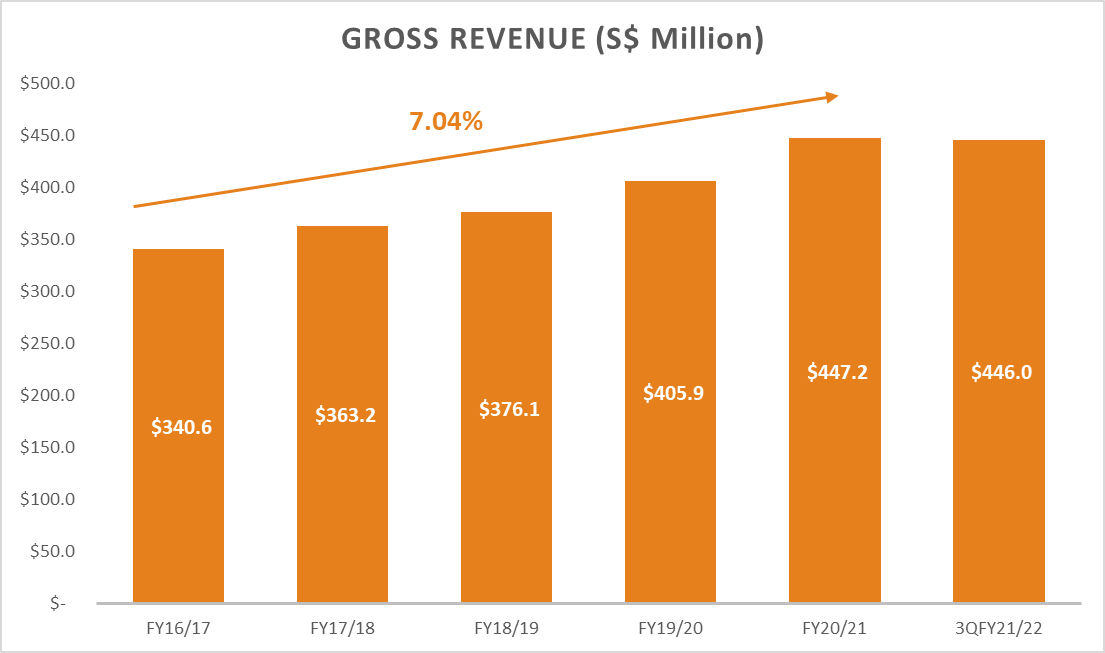
Gross Revenue increased 36.8% year-over-year from S$446 million in 3QFY21/22 (Total Q1-Q3 for FY 21/22) to S$326.1 million in 3QFY20/21. This is remarkable for a REIT to be growing at such a rapid rate. This strong performance is driven primarily by contribution from the portfolio acquisition of data centers in North America back in May 2021. The CAGR of MIT’s Gross Revenue over 5 years grew at a steady pace of 7% from FY16/17 to FY20/21.

Net Property Income (NPI) increased 34.2% year-over-year from S$347.8 million in 3QFY21/22 (Total Q1-Q3 for FY 21/22) to S$259.2 million in 3QFY20/21. Similar to the Gross Revenue, its strong performance is attributed to the portfolio acquisition of data centers. The Property Operating Expenses also increased 46.6% year-over-year from S$98.2 million 3QFY21/22 to S$67.0 million in 3QFY20/21 due to additional operating expenses by data centers. This increase in property operating expenses was partly offset by lower marketing commissions, property maintenance expenses and utilities. The CAGR of MIT’s NPI over 5 years grew at a strong pace of 8.13% from FY16/17 to FY20/21.
Distributable Income & Distribution Per Unit
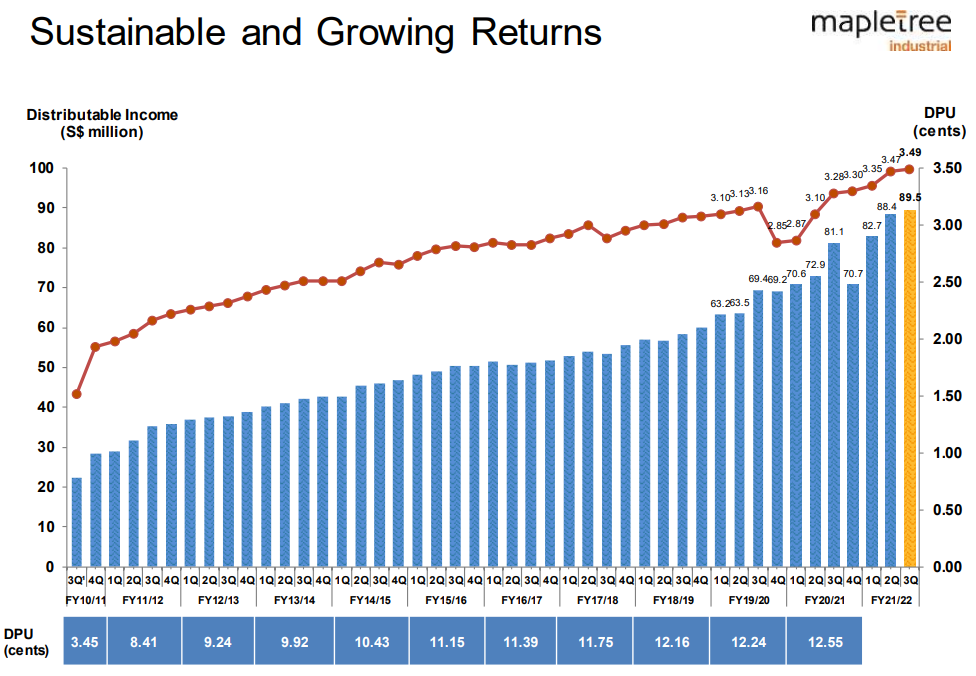
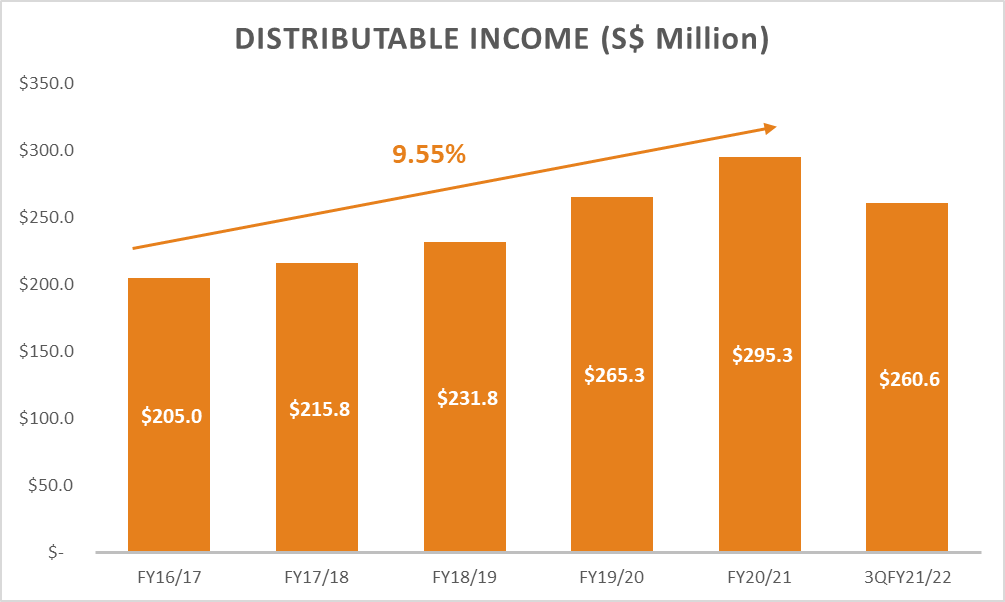
Distributable Income increased 16.1% year-over-year from S$260.6 million in 3QFY21/22 (Total Q1-Q3 for FY 21/22) to S$224.5 million in 3QFY20/21. The CAGR of MIT’s Distributable Income over 5 years grew at a rapid pace of 9.55% from FY16/17 to FY20/21.

Distribution Per Unit (DPU) increased 11.5% year-over-year from (S$) 9.25 cents in 3QFY20/21 (S$) (Total Q1-Q3 for FY 20/21) to (S$) 10.31 cents in 3QFY21/22. The CAGR of MIT’s DPU over 5 years grew steadily at 2.45% from FY16/17 to FY20/21.
Gearing Ratio & Property Yield

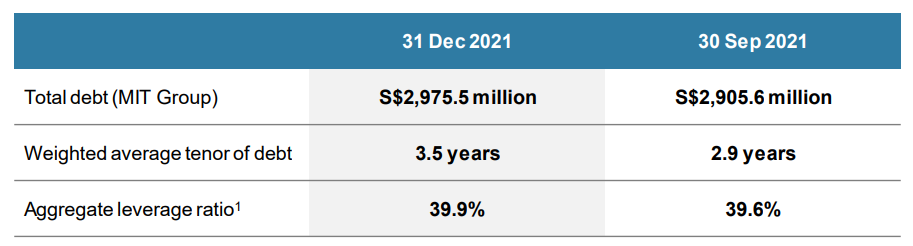
MIT’s gearing ratio is 39.90% as at 3QFY21/22. MIT total debt increased to $2.98 billion, where the weighted average tenor of debt is 3.5 years. MIT is financially sound as it has additional $371.9 million and $743.9 million in debt headroom before meeting its 45% and 50% gearing limits respectively (In April 2020, MAS raised the leveraged ceiling for S-REITS from 45% to 50%).
Furthermore, MIT still have a strong balance sheet to purse growth opportunities:
- ‘BBB+’ rating with stable outlook by Fitch Ratings
- 100% of loans unsecured with minimal covenants
- Distribution reinvestment plan will resume with effect from 3QFY21/22 distribution
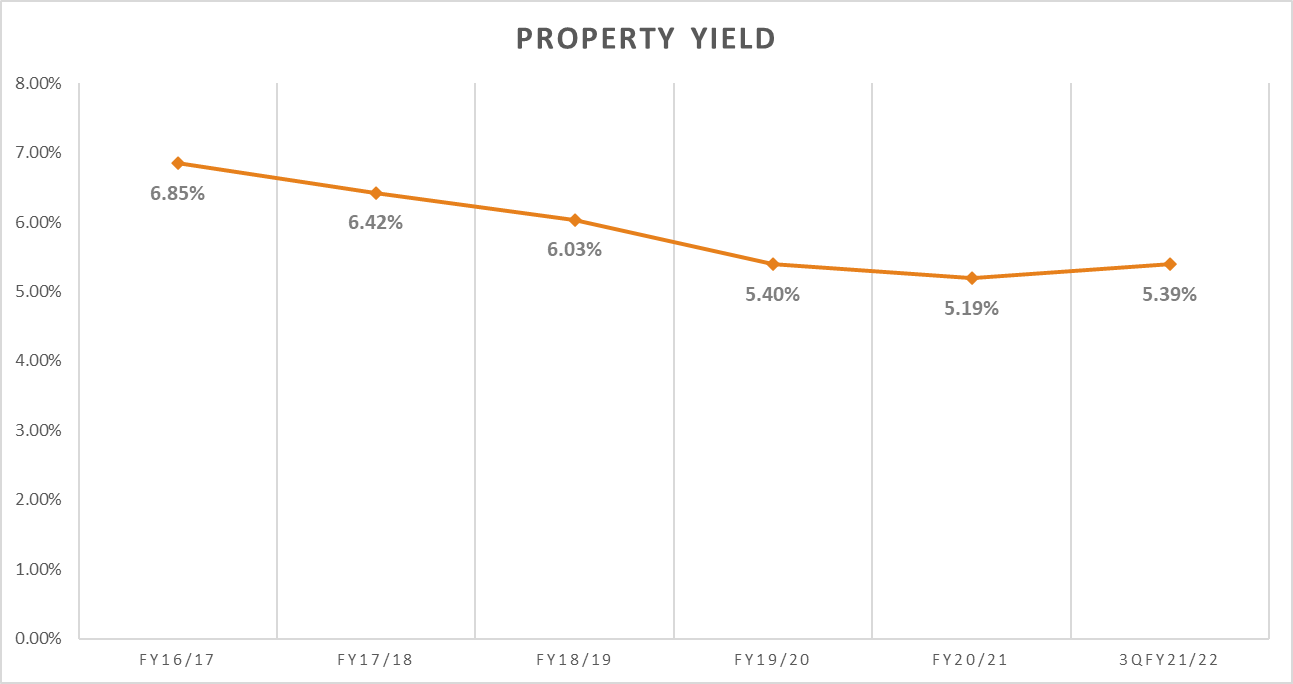
Similarly, MIT’s property yield increased slightly to 5.39% in 3QFY21/22 from 5.19% in FY21. This could be due to an increase in valuation, where valuations were depressed previously during the start of the pandemic.
Occupancy Rate
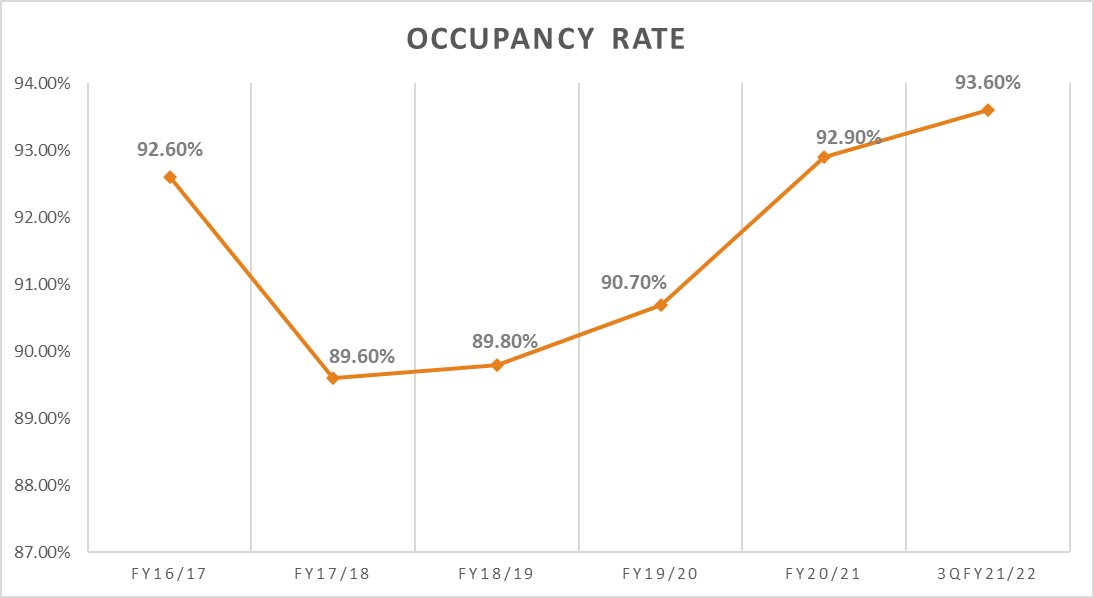
MIT’s Occupancy rate of Singapore Portfolio is 93.7% while North America is 93.3%. The average overall portfolio occupancy is 93.7% for 3QFY21/22. In addition, MIT also announced a proposed divestment of 19 Changi South Street 1 for S$13.0 million on 23 December 2021.
Debt Risk Management
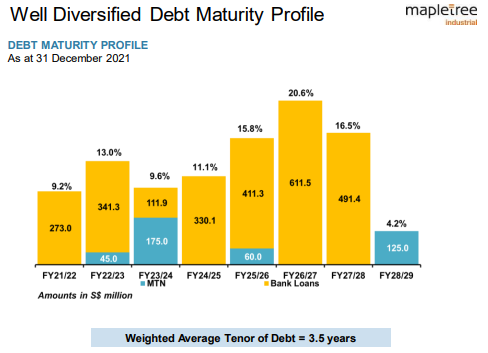
MIT’s Weighted Average Tenor of Debt is 3.5 years. Furthermore, MIT has an impressive Interest Coverage Ratio (“ICR) for 3QFY21/22 of 6.4 times, this demonstrates its solid financial health and ability to satisfy interest commitments.
Rental Reversions

There are several Rental Revisions in MIT Singapore Portfolio. Below is the Gross Rental Rate (S$ PSF/MONTH). Let’s check them out:
- Hi-Tech Buildings
- Before Renewal: $2.41
- After Renewal: $2.45 (+1.66%)
- New Leases: $3.12
- Business Park Buildings
- Before Renewal: $3.08
- After Renewal: $3.08
- New Leases: $3.72
- Flatted Factories
- Before Renewal: $1.91
- After Renewal: $1.91
- New Leases: $1.73
- Stack-Up/Ramp-Up Buildings
- Before Renewal: $1.26
- After Renewal: $1.27 (+0.79%)
- Light Industrial Buildings
- Before Renewal: $1.90
- After Renewal: $2.20 (+15.79%)
Growth Prospects
In the Singapore Portfolio, the redevelopment at 161, 163 & 165 Kallang Way is slated for full completion in 1H2023. The redevelopment of flatted factories into new high-tech buildings, including a seven-story Build-To-Suite (BTS) Facility. The BTS facility is 100% committed by Anchor Tenant (Global Medical Device company headquartered in Germany) which has a lease term of 15+5+5 years (Includes a rent-free period of 6 months distributed over the first six years) with annual rental escalation.
The North America Portfolio remains a resilient asset class with growth opportunities. According to CBRE3, wholesale colocation inventory in key data center markets has more than doubled since 2016 to 3.08 gigawatts since 2016. With 527.6 megawatts now under construction in key markets, the data center sector’s rapid expansion is expected to continue in 2022.
Moreover, space and power constraints may limit future growth, leading to a rise in colocation asking rates and more developers exploring vertical data center building. Furthermore, supply chain interruptions caused by the pandemic might stifle data center construction and postpone the delivery of new supplies, potentially boosting rents in affected markets by 4% to 6%.
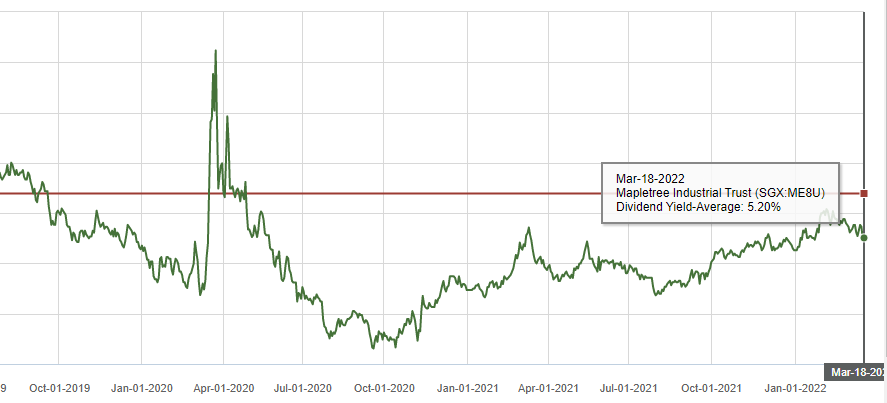
Dividend Yield
MapleTree Industrial Trust – Dividend Yield (5 Year)
The current Dividend Yield of MIT stands at 4.75%,it’s 5-year Avg Yield stands at 5.20%
MapleTree Industrial Trust -Dividend Yield (1 Year)

The current Dividend Yield of MIT stands at 4.75%,it’s 5-year Avg Yield stands at 4.57%
Our Stand
MIT has been one of the best performing REITs since its inception, MIT has also built a long-term track record of delivering:
- Strong historical growth in Gross Revenue, NPI and DPU
- Strong tailwinds for future growth – North America Portfolio
- Management has demonstrated a track record of acquisition success.
MIT, with its strong fundamentals, appears fairly priced to me, with a current dividend yield of 4.75%.If the yield rises to 5~6%, I would consider adding it to my portfolio.
If you are keen, check out our articles on other analysis: Trust Bank Referral
Disclaimer: The information provided by LearnToInvest serves as an educational piece and is not intended to be personalised investment advice. Readers should always do their own due diligence and consider their financial goals before investing in any stock.