
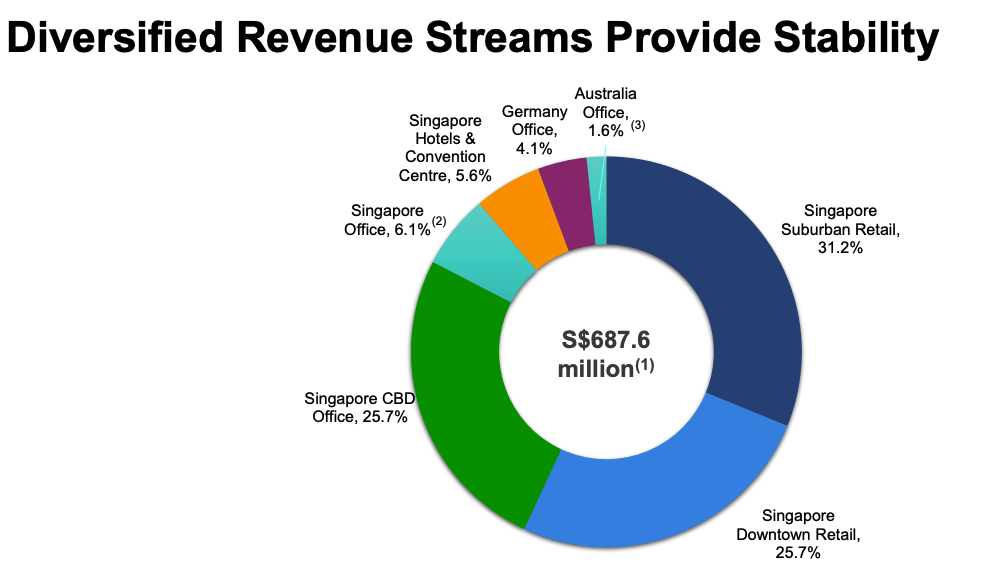
Capitaland Integrated Commercial Trust (CICT) is the first and one of the largest real estate investments in Singapore. CICT’s property portfolio comprises 26 retail and office properties across Singapore, Australia and Germany. The retail portfolio has approximately 11.9 million square feet of net lettable area with over 406 leases.
CICT is among the TOP 10 largest Singapore REITs (“S-REITs”) by market capitalisation. It has an asset under management of SGD 24.2 billion.
Let’s take a look at what Capitaland Integrated Commercial Trust has to offer.
1. Overview of CICT Business
Key Highlights to Note:
- Singapore Portfolio: 5 Integrated Developments, 6 Offices, 10 Retail malls
- Australia Portfolio: 3 Office buildings
- Germany Portfolio: 2 Office buildings
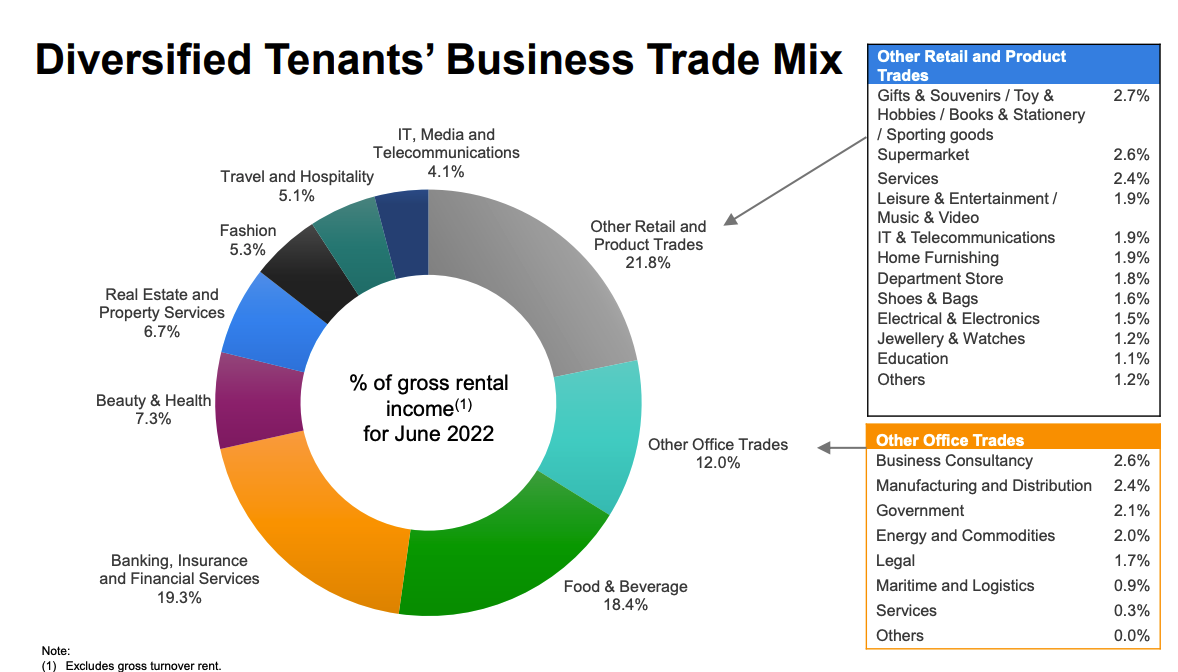
- Key Business Mix: F&B, Banking Insurance, Retail and Product Trades
2. Gross Revenue & Net Property Income for CICT
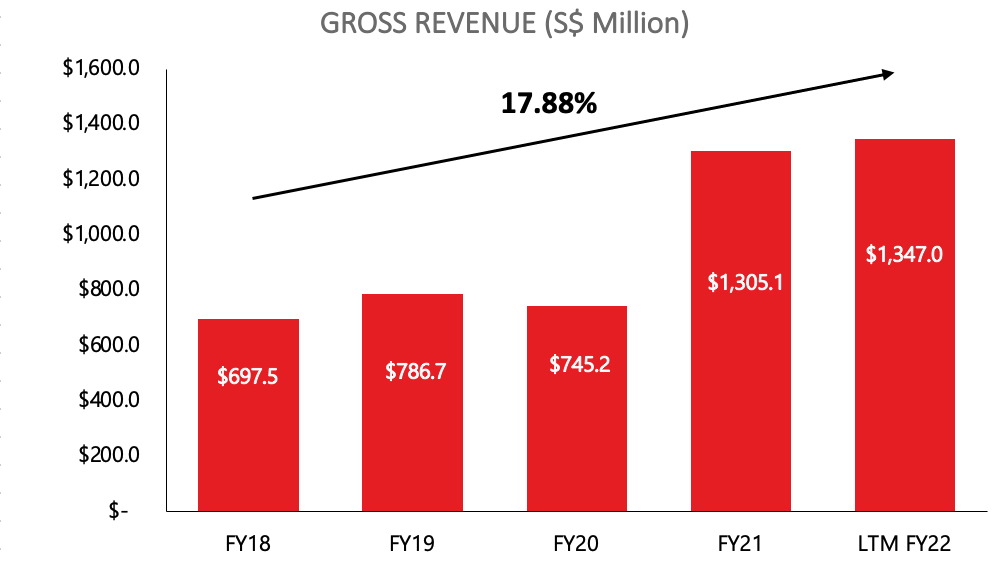
Gross Revenue increased 175.13% year-over-year from S$745.2 million in FY20 to S$1305.1 million in FY21. This exponential increase is greatly boosted by the enlarged office portfolio and 100% revenue contribution from Raffles City Singapore.
The CAGR of CICT’s Gross Revenue over 5 years grew at an astounding rate of 17.88% from FY18 to LTM FY22.
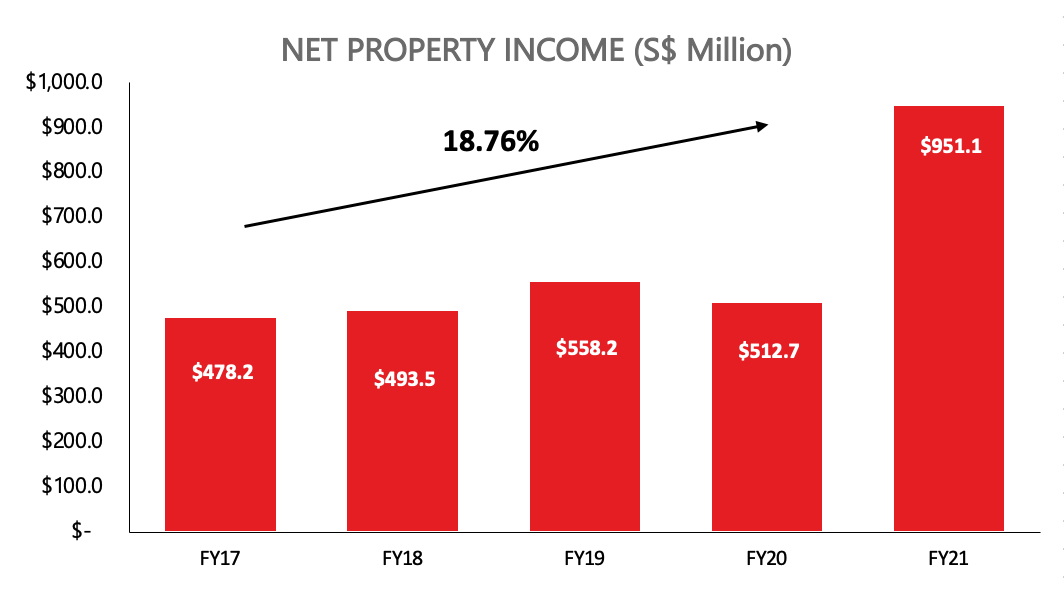
Net Property Income (NPI) increased 185.5% year-over-year from S$512.7 million in FY20 to S$951.1 million in FY21. Similar to the Gross Revenue, its strong performance is attributed to the portfolio acquisition and increased contribution from Raffles City. Furthermore, FY21 Net Property Income margin recovered to 72.8% from 68.8% in FY20. The CAGR of CICT’s NPI over 5 years grew at a strong pace of 18.76% from FY17 to FY21.
3. Distributable Income & Distribution Per Unit for CICT
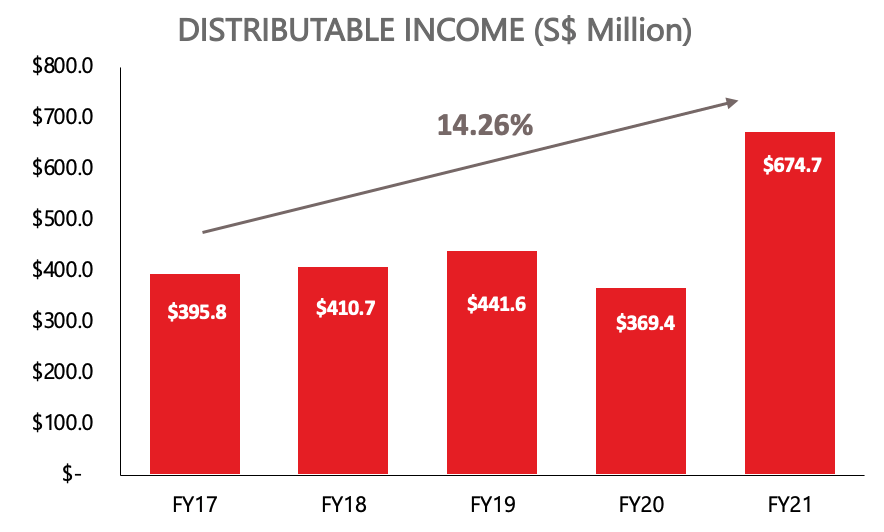
Distributable Income increased 182.6% year-over-year from S$369.4 million in FY20 to S$674.7 million in FY21. The CAGR of CICT’s Distributable Income over 5 years grew at a rapid pace of 14.26% from FY17 to FY21.

Distribution Per Unit (DPU) increased 19.7% year-over-year from (S$) 8.69 cents in FY20 to (S$) 10.40 cents in FY21. FY21 DPU of (S$) 10.40 cents represents a trading yield of 5.97% based on the closing price of S$1.74 on 21 October 2022. The CAGR of CICT’s DPU over 5 years stagnants at -1.75% from FY17 to FY21.
4. Gearing Ratio & Property Yield for CICT

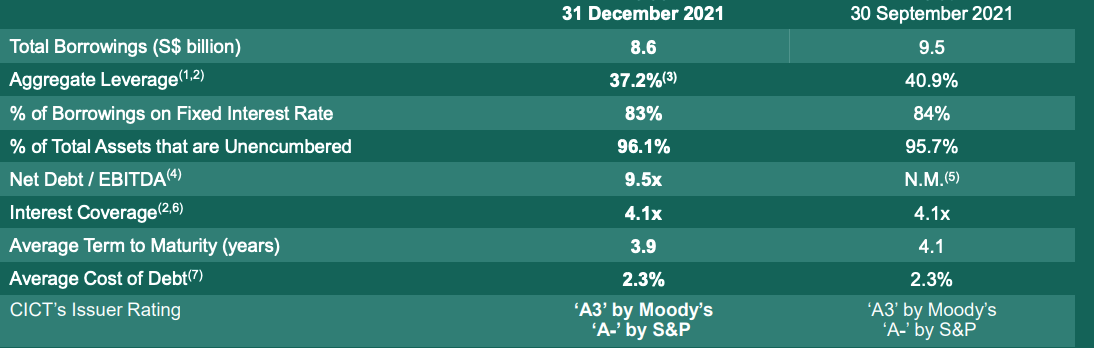
CICT’s gearing ratio is 37.2% as at 30th Dec 2021. CICT total debt increased to $8.6 billion, where the weighted average tenor of debt is 3.9 years. CICT is financially sound as it has additional $1.8 billion and $2.96 billion in debt headroom before meeting its 45% and 50% gearing limit respectively (In April 2020, MAS raised the leveraged ceiling for S-REITS from 45% to 50%).
Furthermore, CICT still have a strong balance sheet to purse growth opportunities:
- ‘A-’ rating with stable outlook by S&P and ‘A3’ rating with stable outlook by Moody’s
- 4.1 times YTD Interest Coverage
- 83% of debt hedged to fixed rate interest
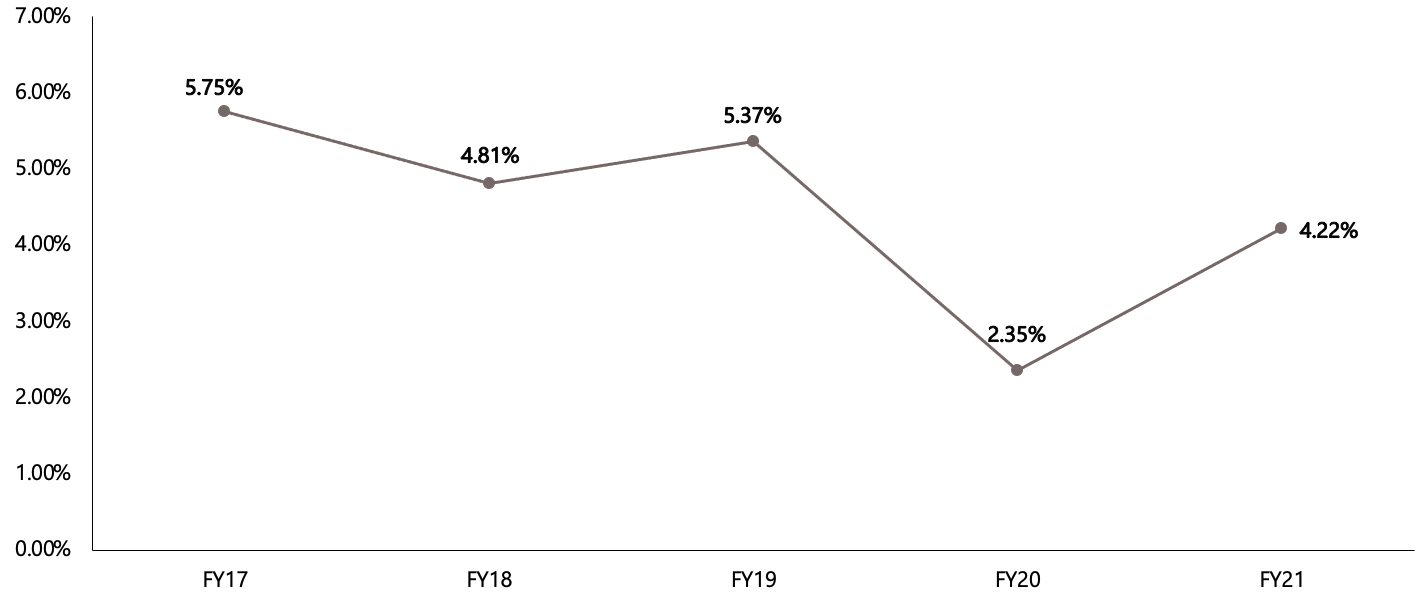
Similarly, CICT’s property yield increased slightly to 4.22% in FY21 from 2.35% in FY20. This could be due to an increase in valuation, where valuations were depressed previously during the start of the pandemic.
5. CICT Occupancy Rate (5 Years)

CICT’s Occupancy rate of the Overall Portfolio is 93.9% in FY21 from 96.4% in FY20. This is mostly attributable to the addition of office assets to their portfolio. In general, the occupancy rate of office buildings is generally lower compared to retail shopping centers.
6. CICT Debt Risk Management

CICT’s Average Debt Maturity is 3.9 years. Furthermore, CICT has an impressive Interest Coverage Ratio (ICR) for FY21 of 4.1 times. This demonstrates its solid financial health and ability to satisfy interest commitments. In FY22, it had a total debt of S$9.7 billion.
7. Rental Reversions

The Average Rental Reversion for the Retail Portfolio in 1H FY22 was relatively positive at +1.1%. This is based on the variance between the rent in FY20 incoming lease and the rent in the FY21 outgoing lease.
8. CICT Growth Prospects
There are a couple of potential growth prospects for Capitaland Integrated Commercial Trust.
As of right now, the property occupancy rate is around 94%, thus CICT will be attempting to increase it. This is consistent with Singapore’s retail and office markets’ promising future. For office markets, CBRE Research anticipates an increase in office rentals of 8.3% in 2022. This is significantly higher than the 3.8% rental growth rate in 2021. Renewals and new establishments in the legal and financial sectors are primarily responsible for this. Furthermore, leasing activity is anticipated to be very active in retail markets in 2022. Rents in the suburbs are anticipated to increase because there is still a severe lack of space in Singapore.
In the near-term, the Manager will continue to evaluate asset enhancement and investment opportunities for CICT.
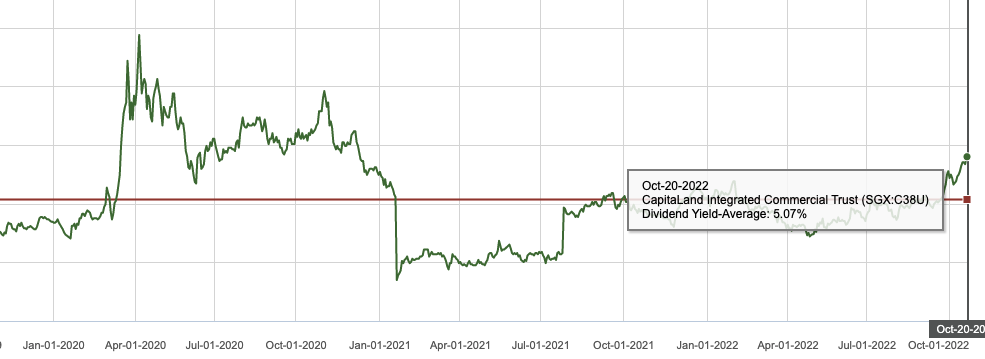
9. CICT Past Dividend Yields
Dividend Yield (5 Year)
The current Dividend Yield of CICT stands at 5.80%,it’s 5-year Avg Yield stands at 5.07%
Dividend Yield (1 Year)
The current Dividend Yield of CICT stands at 5.80%,it’s 1-year Avg Yield stands at 4.94%

10. Our Stand
Capitaland Integrated Commercial Trust has been one of the largest and best performing REITs since its inception. CICT has also built a long-term track record of delivering.
- Consistent historical growth in Gross Revenue, NPI and DPU
- Management are looking for AEI and Acquisition opportunities
- Manageable debt which displays how prudent the management team are
CICT, with its consistent fundamentals, appears slightly undervalued to me, with a current dividend yield of 5.80%. If the yield rises to ~7+%, I would consider adding it to my portfolio.
If you are keen, check out our articles on other analyses: Trust Bank Referral, What is Volatility Index and What is the Consumer Price Index?.
Disclaimer: The information provided by LearnToInvest serves as an educational piece and is not intended to be personalised investment advice. Readers should always do their own due diligence and consider their financial goals before investing in any stock.